
🧠 概要:
概要
この記事では、n8nをOracle Cloudのフリーティアを使用して構築し、AIを用いてDaylioアプリから得たメンタルヘルスのデータを解析するツールを作成した様子が説明されています。このツールを使えば、ユーザーは自身の気分や活動の記録から新たな発見を得ることができます。
要約
- Daylioの利用目的: メンタルヘルスの記録とデータ活用
- ツールの構築: n8nとGoogle Gemini APIを使用してAI解析ツールを構築
- 機能:
- 気分の傾向分析
- 重要な発見の抽出
- 気分改善要因の特定
- 注意が必要なパターンの検出
- 個別的なアドバイス提供
- 目標設定
- 必要な物:
- n8n(セルフホスト版またはクラウド版)
- Google Gemini APIキー
- Daylioアプリ(データ収集用)
- ウェブブラウザ
- セットアップ手順:
- Google Gemini APIキー取得
- n8nワークフロー設定
- Frontend用HTMLファイル準備
- 使い方:
- DaylioからCSVエクスポート
- HTMLファイルを開く
- Webhook URLを入力し、CSVファイルを選択
- 分析開始ボタンをクリック
- 技術的ポイント:
- n8nのノーコード化の利点
- LangChainによるAIとの連携
- Google Geminiのコストパフォーマンス
- セキュリティ: APIキー管理、データ送信の暗号化
- カスタマイズの可能性: プロンプトやレポートのデザイン変更
- 結論: ツールを使って自らのメンタルヘルスについての新たな洞察を得ることが可能。試してみることを奨励。
Daylioでメンタルヘルスの記録をつけていますか?
毎日の気分や活動を記録していますが、「毎日記録してるなら、そのデータをもっと活用できないか」と思っていました。単純な統計グラフだけでなく、AIによる解析をしたらもっと何か見えてくるのではないか、と思って作ってみることにしました。(OracleCloudで立ち上げる話はまた別に記述します)
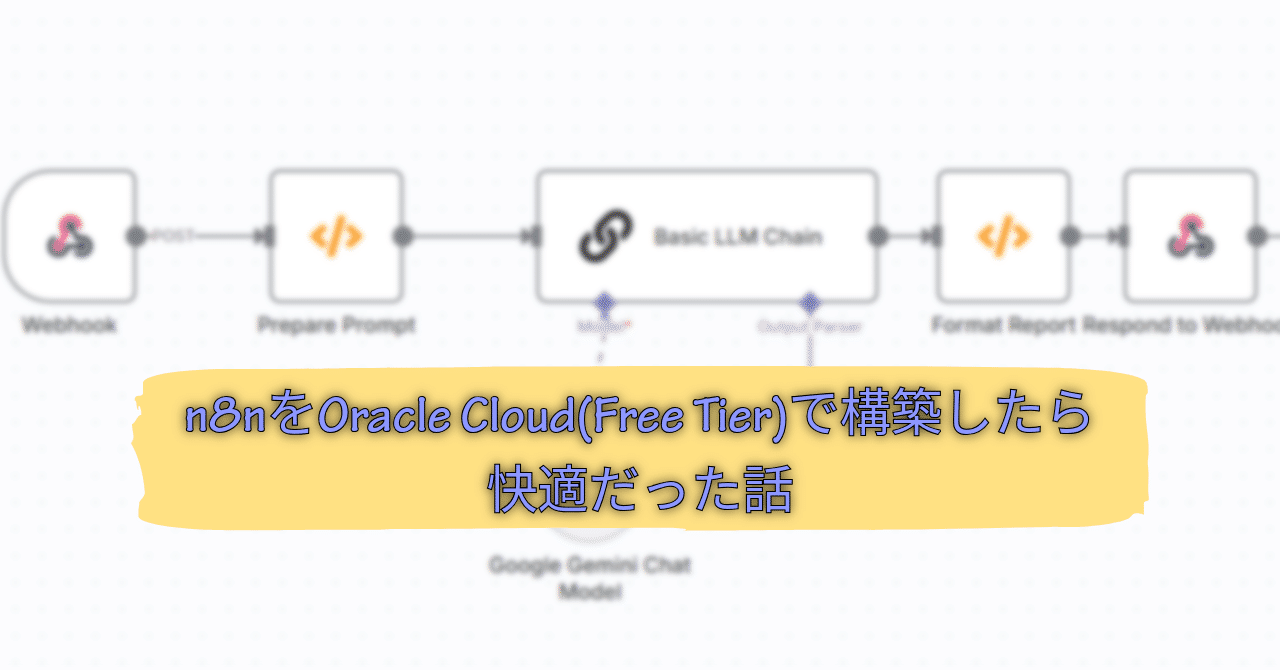
n8n(ノーコード自動化ツール)とGoogle Geminiを組み合わせて、DaylioのデータをAIで分析するツールを作りました。作りました、といっても、Claude Opus4でほぼ組み上げました。
何ができるの?
このツールでは、DaylioからエクスポートしたCSVファイルをアップロードするだけで:
-
📊 全体的な気分の傾向分析
-
💡 データから見つかる重要な発見
-
🎯 気分を良くしている要因の特定
-
⚠️ 注意が必要なパターンの検出
-
🌟 個別化された具体的なアドバイス
-
📈 今後の目標設定
これらすべてを、HTMLレポートとして受け取ることができます。
必要なもの
-
n8n(セルフホスト版 or クラウド版)
-
Google Gemini APIキー(無料で取得可能)
-
Daylioアプリ(記録データ)
-
Webブラウザ(Chrome、Safari、Edgeなど)
セットアップ手順
1. Google Gemini APIキーの取得
-
Google AI Studioにアクセス
-
Googleアカウントでログイン
-
「Create API Key」をクリック
-
生成されたAPIキーをコピー(後で使います)
2. n8nワークフローの設定
2-1. Gemini Credentialの作成
-
n8nにログイン
-
Create Workflowで新規作成し、ノード追加をする
-
「Google Gemini Chat Model」を検索して選択
-
以下を設定:
-
Credential Name: Gemini API(任意)
-
API Key: 先ほどコピーしたAPIキー
-
-
「Save」をクリック
2-2. ワークフローのインポート
-
新しいワークフローを作成
-
以下のJSONをコピーして、ワークフロー画面にペースト(Ctrl+V)
{ "name": "Daylio AI Analysis with LangChain", "nodes": [ { "parameters": { "httpMethod": "POST", "path": "daylio-langchain", "responseMode": "lastNode", "options": { "cors": { "allowedOrigins": "*" } } }, "id": "webhook", "name": "Webhook", "type": "n8n-nodes-base.webhook", "typeVersion": 1, "position": [250, 300], "webhookId": "daylio-langchain" }, { "parameters": { "functionCode": "// CSVデータの取得と構造化nconst csvContent = $json.body?.csvData;nnif (!csvContent) {n throw new Error('CSVデータが見つかりません');n}nn// CSVを行に分割nconst lines = csvContent.split('\n').filter(line => line.trim());nconst headers = lines[0].split(',').map(h => h.trim());nn// ヘッダーのインデックスを取得nconst indices = {n full_date: headers.findIndex(h => h === 'full_date'),n date: headers.findIndex(h => h === 'date'),n weekday: headers.findIndex(h => h === 'weekday'),n time: headers.findIndex(h => h === 'time'),n mood: headers.findIndex(h => h === 'mood'),n activities: headers.findIndex(h => h === 'activities'),n _title: headers.findIndex(h => h === '_title'),n : headers.findIndex(h => h === '')n};nn// データを構造化nconst structuredData = [];nfor (let i = 1; i < lines.length; i++) {n const values = lines[i].split(',');n if (values.length >= headers.length && values[indices.date]) {n structuredData.push({n date: values[indices.full_date] || values[indices.date] || '',n weekday: values[indices.weekday] || '',n time: values[indices.time] || '',n mood: values[indices.mood] || '',n activities: values[indices.activities] || '',n : values[indices.] || ''n });n }n}nn// 基本統計を計算nconst moodScores = {n 'rad': 5, 'good': 4, 'meh': 3, 'bad': 2, 'awful': 1,n '最高': 5, '良い': 4, '普通': 3, '悪い': 2, '最悪': 1n};nnlet totalScore = 0;nconst moodCounts = {};nnstructuredData.forEach(record => {n const score = moodScores[record.mood.toLowerCase()] || moodScores[record.mood] || 3;n totalScore += score;n moodCounts[record.mood] = (moodCounts[record.mood] || 0) + 1;n});nnconst avgScore = structuredData.length > 0 ? totalScore / structuredData.length : 0;nn// LLMへのプロンプトを作成nconst prompt = `あなたは優秀なメンタルヘルスアナリストです。以下のDaylioアプリからエクスポートされたデータを分析し、ユーザーのメンタルヘルスについて深い洞察を提供してください。nn## 基本統計n- 総記録日数: ${structuredData.length}日n- 平均気分スコア: ${avgScore.toFixed(2)}/5n- 気分の分布: ${JSON.stringify(moodCounts, null, 2)}nn## 詳細データ(JSON形式)n${JSON.stringify(structuredData, null, 2)}nn## 気分の値n- rad/最高: 最も良い気分(スコア5)n- good/良い: 良い気分(スコア4)n- meh/普通: 普通の気分(スコア3)n- bad/悪い: 悪い気分(スコア2)n- awful/最悪: 最も悪い気分(スコア1)nn## 分析の観点n以下の形式で構造化されたレポートを作成してください:nn### 📊 全体的な傾向n[期間全体の気分の傾向、平均的な状態、特徴的なパターンを説明]nn### 💡 重要な発見n[データから見つかった重要な洞察を箇条書きで3-5個]nn### 🎯 ポジティブな要因n[気分を良くしているアクティビティや要因を分析]nn### ⚠️ 注意が必要な点n[改善の余地がある点や注意すべきパターン]nn### 🌟 具体的なアドバイスn[データに基づいた実践的なアドバイスを3-5個]nn### 📈 今後の目標n[メンタルヘルス改善のための具体的な目標設定]nn分析は共感的で前向きなトーンで行い、ユーザーを励まし、小さな改善も認識してください。`;nnreturn [{n json: {n prompt,n avgScore,n totalDays: structuredData.lengthn }n}];" }, "id": "preparePrompt", "name": "Prepare Prompt", "type": "n8n-nodes-base.function", "typeVersion": 1, "position": [450, 300] }, { "parameters": { "prompt": "={{ $json.prompt }}" }, "id": "llmChain", "name": "Basic LLM Chain", "type": "@n8n/n8n-nodes-langchain.chainLlm", "typeVersion": 1.3, "position": [650, 300] }, { "parameters": { "functionCode": "// LLMの分析結果を取得nconst analysis = $json.text || $json.response || $json.output || 'レスポンスが見つかりません';nn// 基本統計を取得nconst stats = $node["Prepare Prompt"].json;nn// HTMLレポートを生成nconst htmlReport = `n<!DOCTYPE html>n<html lang="ja">n<head>n <meta charset="UTF-8">n <meta name="viewport" content="width=device-width, initial-scale=1.0">n <title>Daylio AI分析レポート</title>n <style>n body {n font-family: -apple-system, BlinkMacSystemFont, 'Segoe UI', Roboto, sans-serif;n background: #f5f7fa;n margin: 0;n padding: 20px;n line-height: 1.6;n color: #333;n }n .container {n max-width: 800px;n margin: 0 auto;n background: white;n border-radius: 15px;n padding: 40px;n box-shadow: 0 10px 30px rgba(0,0,0,0.1);n }n h1 {n color: #1e3c72;n text-align: center;n margin-bottom: 30px;n }n .metric-card {n background: linear-gradient(135deg, #1e3c72 0%, #2a5298 100%);n color: white;n padding: 30px;n border-radius: 15px;n text-align: center;n margin-bottom: 30px;n }n .metric-value {n font-size: 48px;n font-weight: bold;n margin: 10px 0;n }n .analysis-section {n background: #f8f9fa;n padding: 30px;n border-radius: 15px;n margin-bottom: 20px;n white-space: pre-wrap;n }n h2, h3 {n color: #2a5298;n margin-top: 20px;n margin-bottom: 15px;n }n ul {n margin-left: 20px;n line-height: 1.8;n }n li {n margin-bottom: 8px;n }n .footer {n text-align: center;n margin-top: 30px;n color: #666;n font-size: 14px;n }n </style>n</head>n<body>n <div class="container">n <h1>🤖 Daylio AI分析レポート</h1>n n <div class="metric-card">n <div>平均気分スコア</div>n <div class="metric-value">${stats.avgScore.toFixed(2)}</div>n <div>総記録日数: ${stats.totalDays}日</div>n </div>n n <div class="analysis-section">n ${analysis.replace(/\n/g, '<br>').replace(/###/g, '</div><div class="analysis-section"><h3>').replace(/##/g, '</div><div class="analysis-section"><h2>')}n </div>n n <div class="footer">n Generated by Gemini AI via n8n LangChain • ${new Date().toLocaleString('ja-JP')}n </div>n </div>n</body>n</html>n`;nnreturn [{n json: {n success: true,n analysis,n htmlReport,n statistics: {n avgMoodScore: stats.avgScore.toFixed(2),n totalDays: stats.totalDaysn }n }n}];" }, "id": "formatReport", "name": "Format Report", "type": "n8n-nodes-base.function", "typeVersion": 1, "position": [850, 300] }, { "parameters": { "options": {} }, "id": "respond", "name": "Respond to Webhook", "type": "n8n-nodes-base.respondToWebhook", "typeVersion": 1, "position": [1050, 300] } ], "connections": { "Webhook": { "main": [ [] ] }, "Prepare Prompt": { "main": [ [] ] }, "Basic LLM Chain": { "main": [ [] ] }, "Format Report": { "main": [ [] ] } }}2-3. LangChainノードの設定
-
右側のパネルで「Open Node Panel」をクリック
-
「Chat Model」から「Google Gemini Chat Model」を選択
-
設定:
-
Credential: 作成した「Gemini API」を選択
-
Model: gemini-2.0-flashを選択
-
2-4. ワークフローの有効化
-
ワークフローを保存
-
右上のトグルスイッチをONに
-
Webhookノードから生成されるURLをコピー
3. フロントエンド(HTMLファイル)の準備
以下のHTMLコードをdaylio-analyzer.htmlとして保存:
<!DOCTYPE html><html lang="ja"><head> <meta charset="UTF-8"> <meta name="viewport" content="width=device-width, initial-scale=1.0"> <title>Daylio AI分析ツール</title> http://span <style> * { margin: 0; padding: 0; box-sizing: border-box; } body { font-family: -apple-system, BlinkMacSystemFont, 'Segoe UI', Roboto, sans-serif; background: linear-gradient(135deg, min-height: 100vh; padding: 20px; } .container { max-width: 800px; margin: 0 auto; background: rgba(255, 255, 255, 0.98); border-radius: 20px; padding: 40px; box-shadow: 0 20px 60px rgba(0, 0, 0, 0.3); } h1 { text-align: center; margin-bottom: 30px; font-size: 32px; background: linear-gradient(135deg, -webkit-background-clip: text; -webkit-text-fill-color: transparent; } .config-section { background: border: 1px solid border-radius: 10px; padding: 20px; margin-bottom: 20px; } .webhook-input { width: 100%; padding: 12px; border: 2px solid border-radius: 8px; font-size: 14px; margin-top: 10px; font-family: monospace; } .upload-section { background: border: 2px dashed border-radius: 15px; padding: 40px; text-align: center; margin-bottom: 30px; transition: all 0.3s ease; } .upload-section:hover { border-color: background: } .upload-section.dragover { background: border-color: } .file-input-label { display: inline-block; padding: 15px 40px; background: linear-gradient(135deg, color: white; border-radius: 30px; cursor: pointer; font-weight: 600; font-size: 16px; transition: all 0.3s ease; box-shadow: 0 4px 15px rgba(30, 60, 114, 0.3); } .file-input-label:hover { transform: translateY(-2px); box-shadow: 0 6px 20px rgba(30, 60, 114, 0.4); } input[type="file"] { display: none; } .analyze-button { display: none; width: 100%; padding: 15px; background: linear-gradient(135deg, color: white; border: none; border-radius: 10px; font-size: 18px; font-weight: 600; cursor: pointer; margin: 20px 0; transition: all 0.3s ease; } .analyze-button:hover:not(:disabled) { transform: translateY(-2px); box-shadow: 0 6px 20px rgba(0, 206, 201, 0.4); } .analyze-button:disabled { background: cursor: not-allowed; transform: none; } .loading { display: none; text-align: center; margin: 30px 0; } .spinner { width: 50px; height: 50px; border: 5px solid border-top: 5px solid border-radius: 50%; animation: spin 1s linear infinite; margin: 0 auto; } @keyframes spin { 0% { transform: rotate(0deg); } 100% { transform: rotate(360deg); } } .results-section { display: none; animation: fadeIn 0.5s ease; } @keyframes fadeIn { from { opacity: 0; transform: translateY(20px); } to { opacity: 1; transform: translateY(0); } } .error-message { background: color: padding: 15px; border-radius: 10px; margin: 20px 0; display: none; } .success-message { background: color: padding: 15px; border-radius: 10px; margin: 20px 0; display: none; } .info-box { background: color: padding: 15px; border-radius: 10px; margin-bottom: 20px; font-size: 14px; } .report-frame { width: 100%; min-height: 800px; border: none; border-radius: 10px; background: white; box-shadow: 0 5px 15px rgba(0, 0, 0, 0.1); } .file-info { margin-top: 15px; padding: 10px; background: border-radius: 8px; font-size: 14px; color: } .display-options { display: flex; gap: 10px; margin-bottom: 20px; flex-wrap: wrap; } .option-button { padding: 8px 16px; background: color: white; border: none; border-radius: 5px; cursor: pointer; font-size: 14px; } .option-button:hover { background: } .option-button.active { background: } </style></head><body> <div class="container"> <h1>🤖 Daylio AI分析ツール</h1> <div class="info-box"> <strong>📌 使い方:</strong> <ol style="margin-left: 20px; margin-top: 10px;"> <li>n8nのWebhook URLを設定</li> <li>DaylioからエクスポートしたCSVファイルを選択</li> <li>「AI分析を開始」ボタンをクリック</li> <li>分析結果が表示されます</li> </ol> </div> <div class="config-section"> <label for="webhookUrl"><strong>🔗 n8n Webhook URL:</strong></label> <input type="text" id="webhookUrl" class="webhook-input" placeholder="https://your-n8n-instance.com/webhook/daylio-analysis" value=""> </div> <div class="upload-section" id="uploadSection"> <label for="csvFile" class="file-input-label"> 📂 CSVファイルを選択 </label> <input type="file" id="csvFile" accept=".csv"> <p style="margin-top: 15px; color: #666;"> ドラッグ&ドロップでもアップロード可能です </p> <div id="fileInfo" class="file-info" style="display: none;"></div> </div> <button id="analyzeButton" class="analyze-button"> 🚀 AI分析を開始 </button> <div class="loading" id="loading"> <div class="spinner"></div> <p style="margin-top: 20px; color: #666;"> AIが分析中です...<br> <small>(最大1分程度かかる場合があります)</small> </p> </div> <div class="error-message" id="errorMessage"></div> <div class="success-message" id="successMessage"></div> <div class="results-section" id="results"></div> </div> <script> let csvContent = null; let fileName = null; let currentReportHtml = null; const savedWebhookUrl = localStorage.getItem('n8nWebhookUrl'); if (savedWebhookUrl) { document.getElementById('webhookUrl').value = savedWebhookUrl; } document.getElementById('webhookUrl').addEventListener('input', function(e) { localStorage.setItem('n8nWebhookUrl', e.target.value); }); const uploadSection = document.getElementById('uploadSection'); uploadSection.addEventListener('dragover', function(e) { e.preventDefault(); this.classList.add('dragover'); }); uploadSection.addEventListener('dragleave', function(e) { e.preventDefault(); this.classList.remove('dragover'); }); uploadSection.addEventListener('drop', function(e) { e.preventDefault(); this.classList.remove('dragover'); const files = e.dataTransfer.files; if (files.length > 0 && files[0].type === 'text/csv') { handleFile(files[0]); } }); document.getElementById('csvFile').addEventListener('change', function(e) { const file = e.target.files[0]; if (file) { handleFile(file); } }); function handleFile(file) { fileName = file.name; const reader = new FileReader(); reader.onload = function(e) { csvContent = e.target.result; displayFileInfo(file); document.getElementById('analyzeButton').style.display = 'block'; }; reader.readAsText(file); } function displayFileInfo(file) { const fileInfo = document.getElementById('fileInfo'); const size = (file.size / 1024).toFixed(2); Papa.parse(file, { header: true, complete: function(results) { const recordCount = results.data.filter(row => row.date && row.mood).length; fileInfo.innerHTML = ` <strong>📄 ${file.name}</strong><br> サイズ: ${size} KB | レコード数: ${recordCount}件 `; fileInfo.style.display = 'block'; } }); } document.getElementById('analyzeButton').addEventListener('click', async function() { const webhookUrl = document.getElementById('webhookUrl').value; if (!webhookUrl) { showError('n8n Webhook URLを入力してください'); return; } if (!csvContent) { showError('CSVファイルを選択してください'); return; } await sendToN8n(webhookUrl, csvContent); }); async function sendToN8n(webhookUrl, csvData) { const button = document.getElementById('analyzeButton'); const loading = document.getElementById('loading'); const results = document.getElementById('results'); button.disabled = true; loading.style.display = 'block'; results.style.display = 'none'; hideMessages(); try { console.log('送信中...', webhookUrl); const response = await fetch(webhookUrl, { method: 'POST', headers: { 'Content-Type': 'application/json', }, body: JSON.stringify({ csvData: csvData, fileName: fileName, timestamp: new Date().toISOString() }) }); if (!response.ok) { throw new Error(`HTTPエラー: ${response.status}`); } const result = await response.json(); console.log('レスポンス受信:', result); showSuccess('分析が完了しました!'); displayResults(result); } catch (error) { console.error('Error:', error); if (error.message.includes('Failed to fetch')) { showError('n8nサーバーに接続できません。Webhook URLを確認してください。'); } else { showError('分析中にエラーが発生しました: ' + error.message); } } finally { button.disabled = false; loading.style.display = 'none'; } } function displayResults(data) { const results = document.getElementById('results'); currentReportHtml = data.htmlReport; if (data.htmlReport) { results.innerHTML = ` <h2 style="color: #1e3c72; margin-bottom: 20px;">📊 AI分析レポート</h2> <div class="display-options"> <button class="option-button active" onclick="showIframe()">埋め込み表示</button> <button class="option-button" onclick="showNewWindow()">新しいウィンドウ</button> <button class="option-button" onclick="downloadReport()">HTMLダウンロード</button> </div> <div id="reportContainer"></div> `; showIframe(); } else if (data.analysis) { results.innerHTML = ` <h2 style="color: #1e3c72; margin-bottom: 20px;">📊 AI分析結果</h2> <div style="background: #f8f9fa; padding: 20px; border-radius: 10px; white-space: pre-wrap;"> ${data.analysis.replace(/</g, '<').replace(/>/g, '>')} </div> `; } else { results.innerHTML = ` <h2 style="color: #1e3c72; margin-bottom: 20px;">📊 分析結果</h2> <pre style="background: #f8f9fa; padding: 20px; border-radius: 10px; overflow-x: auto;"> ${JSON.stringify(data, null, 2)} </pre> `; } results.style.display = 'block'; } function showIframe() { if (!currentReportHtml) return; const container = document.getElementById('reportContainer'); const blob = new Blob([currentReportHtml], { type: 'text/html;charset=utf-8' }); const url = URL.createObjectURL(blob); container.innerHTML = `http://span`; updateActiveButton(0); } function showNewWindow() { if (!currentReportHtml) return; const newWindow = window.open('', '_blank'); newWindow.document.write(currentReportHtml); newWindow.document.close(); updateActiveButton(1); } function downloadReport() { if (!currentReportHtml) return; const blob = new Blob([currentReportHtml], { type: 'text/html;charset=utf-8' }); const url = URL.createObjectURL(blob); const a = document.createElement('a'); a.href = url; a.download = `daylio-report-${new Date().toISOString().split('T')[0]}.html`; a.click(); URL.revokeObjectURL(url); updateActiveButton(2); } function updateActiveButton(index) { const buttons = document.querySelectorAll('.option-button'); buttons.forEach((btn, i) => { if (i === index) { btn.classList.add('active'); } else { btn.classList.remove('active'); } }); } function showError(message) { const errorDiv = document.getElementById('errorMessage'); errorDiv.textContent = message; errorDiv.style.display = 'block'; setTimeout(() => { errorDiv.style.display = 'none'; }, 5000); } function showSuccess(message) { const successDiv = document.getElementById('successMessage'); successDiv.textContent = message; successDiv.style.display = 'block'; setTimeout(() => { successDiv.style.display = 'none'; }, 3000); } function hideMessages() { document.getElementById('errorMessage').style.display = 'none'; document.getElementById('successMessage').style.display = 'none'; } </script></body></html>使い方
1. DaylioからCSVをエクスポート
-
Daylioアプリを開く
-
設定 → エクスポート → CSV
-
ファイルを保存
2. 分析を実行
-
保存したHTMLファイルをブラウザで開く
-
n8nのWebhook URLを入力
-
CSVファイルを選択(ドラッグ&ドロップも可能)
-
「AI分析を開始」をクリック
3. レポートを確認
分析が完了すると、以下のオプションが表示されます:
-
埋め込み表示: ページ内でレポートを確認
-
新しいウィンドウ: 別ウィンドウで全画面表示
-
HTMLダウンロード: レポートを保存
技術的なポイント
なぜn8nとLangChainを選んだか
-
n8n: ノーコードで複雑な処理を実現
-
LangChain: AIとの連携を簡単に
-
Google Gemini: 無料枠が大きく、個人使用であればほぼ課金されずに済むため
セキュリティ面の配慮
-
APIキーはn8nのCredentialsで安全に管理
-
データは暗号化された通信で送信
-
ローカルで動作するHTMLファイル
カスタマイズの可能性
-
プロンプトを変更して分析の観点を調整
-
レポートのデザインをカスタマイズ
-
他のAIモデルへの切り替えも簡単
おわりに
このツールを使えば、Daylioの記録がより価値のあるものになります。AIの力を借りて、自分のメンタルヘルスについて新たな発見ができるかもしれません。
ぜひ試してみて、感想を聞かせてください!
参考リンク
ライセンス
このプロジェクトはMITライセンスで公開しています。自由に使用・改変してください。
Views: 1
